Finances
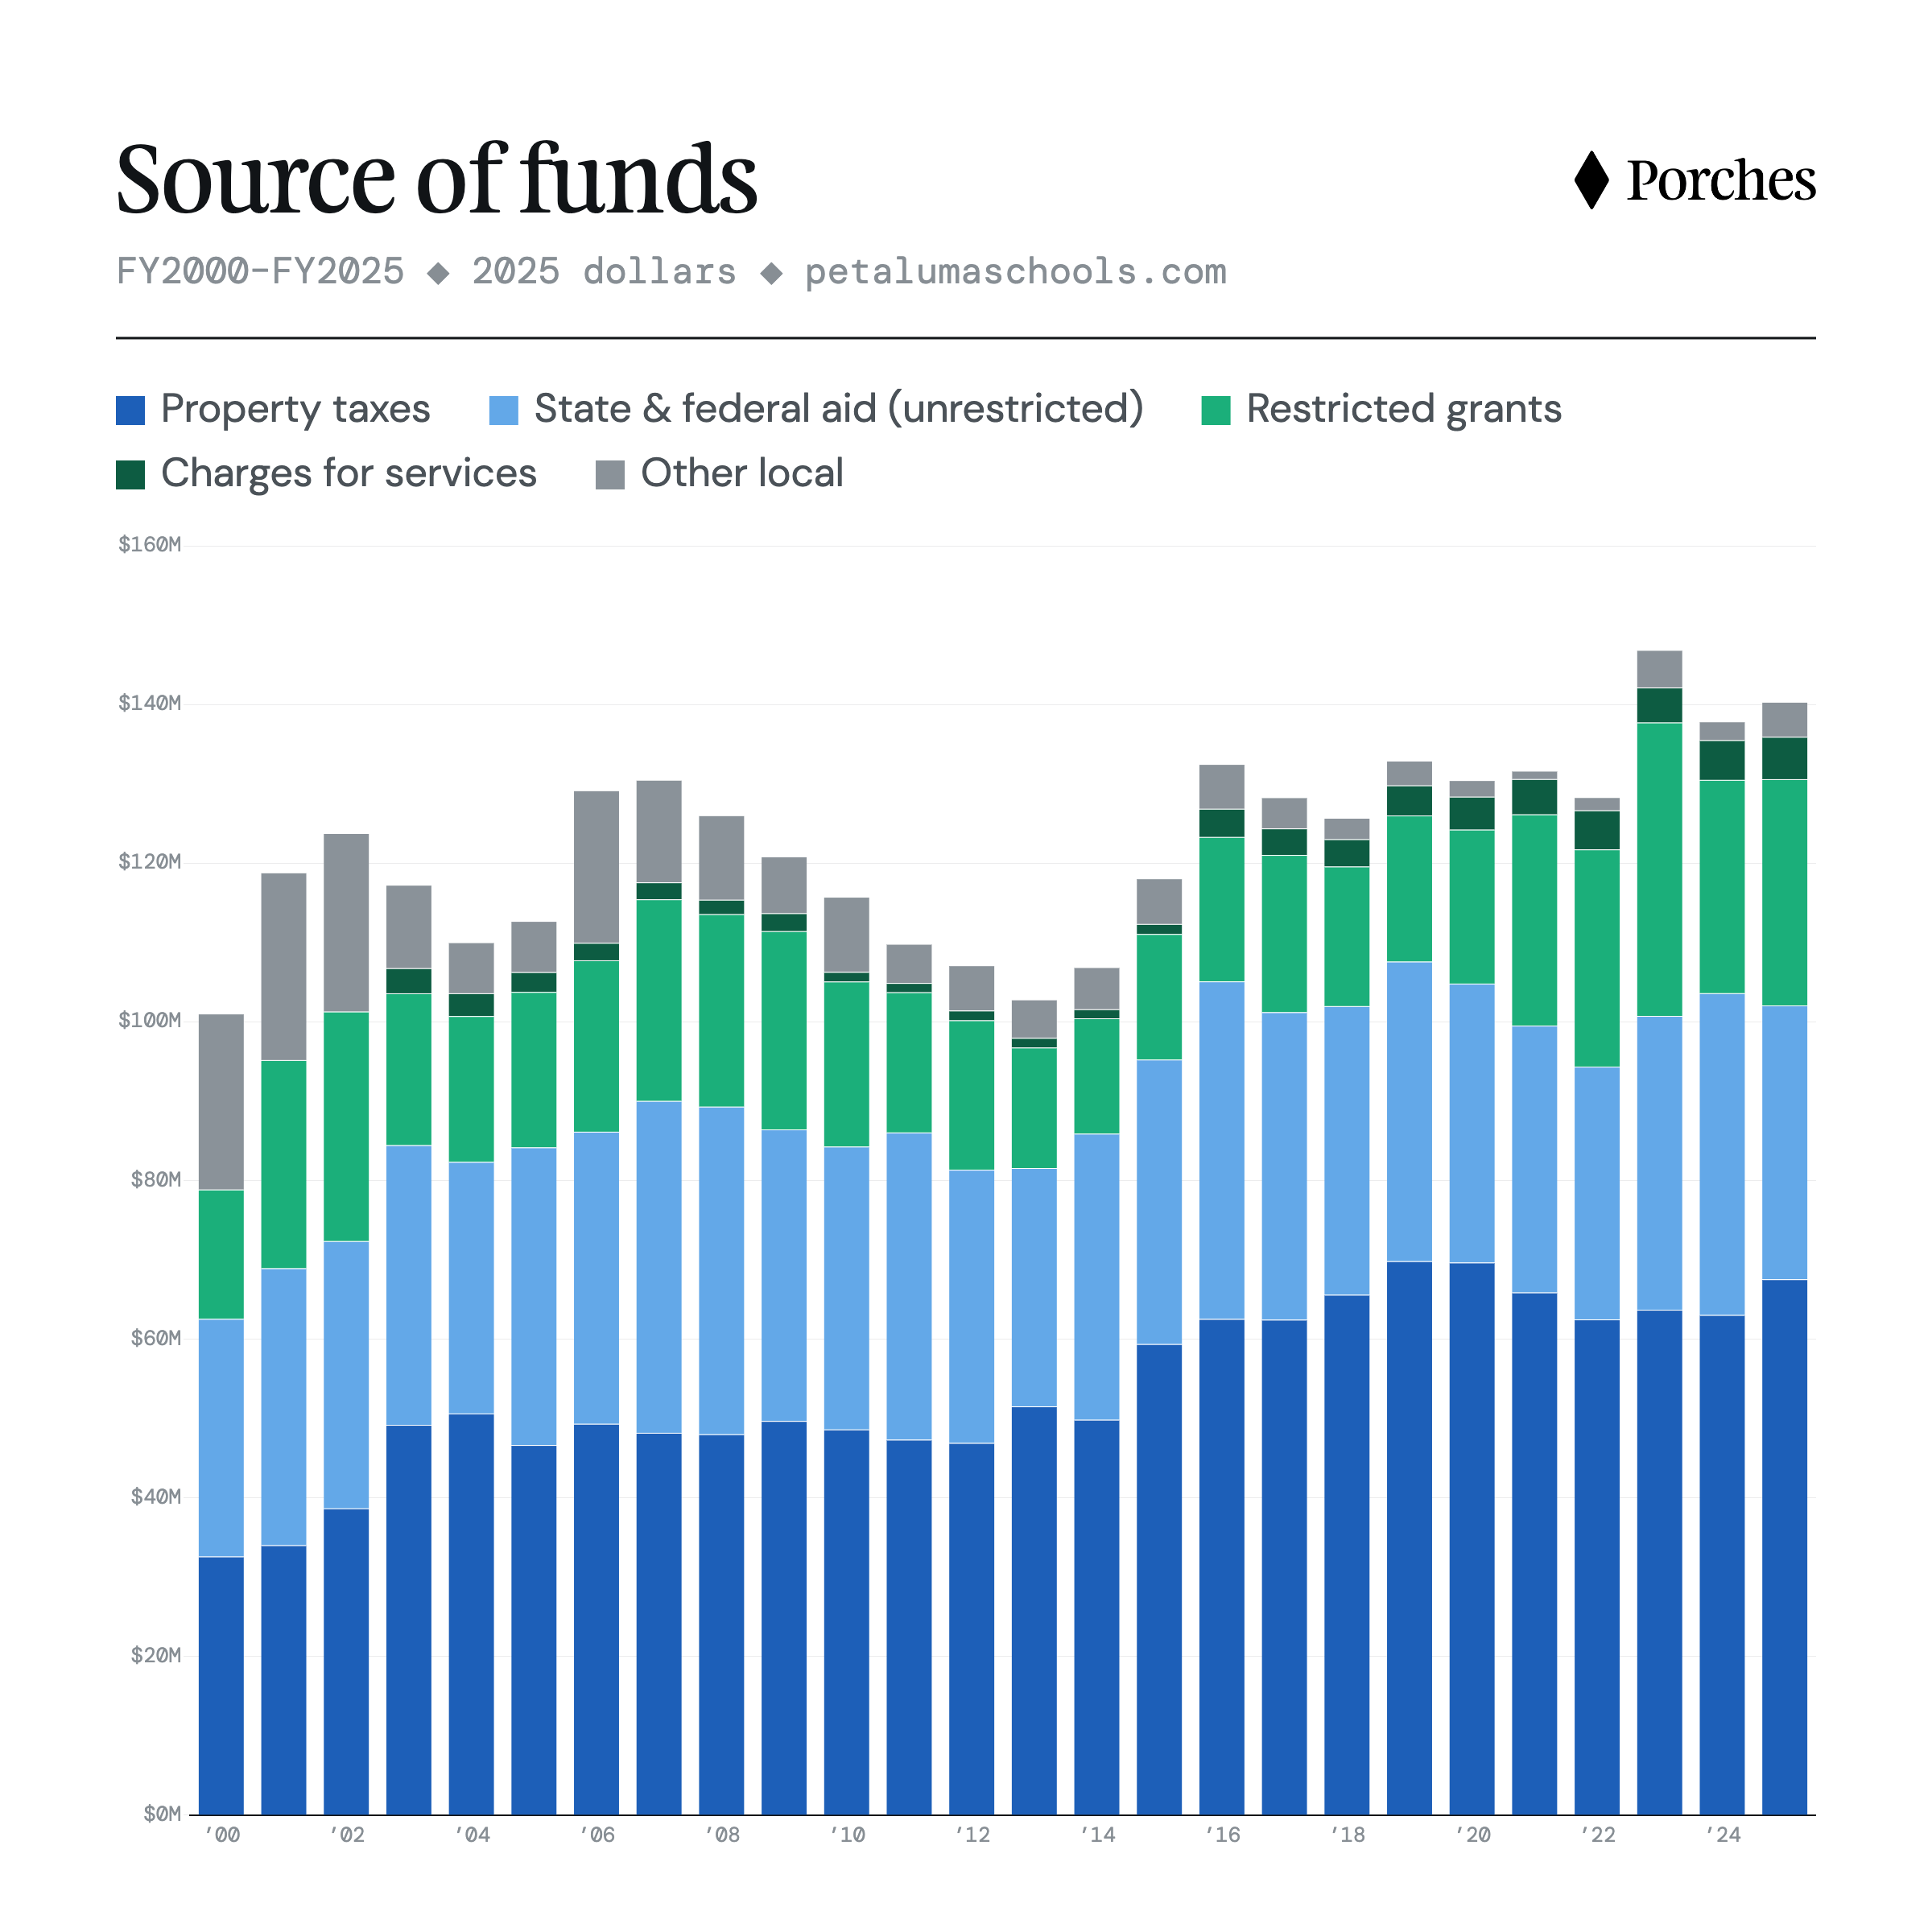
Source of fundsFY2000–FY2025 ◆ both districts combined ◆ audited
★ Property taxes grew from 32% of revenue share in 2000 to 48% by 2025.
★ State unrestricted aid fell $5M from FY24 to FY25, but is still around its historic average after the cut.
Use of fundsFY2003–FY2025 ◆ audited
★ Pupil services and administration grew from 14% of spending in 2003 to 20% in 2025.
Net resultFY2000–FY2025 ◆ revenue − expense
★ A year's result rolls into the district's fund balance: surpluses build reserves that carry forward, deficits spend them down. Districts must keep a minimum reserve (~3% of spending).
★ Sustained deficits appear twice: the recession years (FY2009 to FY2013) and the current stretch (FY2024 to FY2025) as one-time funds rolled off.
Per-student spendingFY2000–FY2025
Total expense ÷ census-day enrollment. Accrual basis (includes pension accruals, depreciation, one-time grant spending). Real per-student spending was roughly flat 2000–2015, then rose ~33% to an all-time high of $19,627.
Special report: 2026 budget cut
On February 10, 2026 the school board unanimously approved $6.1 million in reductions for 2026–27 (about 4% of spending). The proximate cause is visible in the charts above: $15–20 million a year of temporary money (COVID relief, one-time state grants, an expiring parcel tax) entered the budget between 2020 and 2023, while enrollment fell and state unrestricted aid dropped $5 million in FY2025 alone.
The cut is not spread evenly. Mapping the board's line items onto the spending functions above: pupil services and administration absorb most of it (which were the same two functions that grew fastest since 2020).
District spending by function: before and after the cut
Breakdown of the adopted cuts by function: $6.1M total
The board communicated the plan for the adopted cuts using a mix of funding source and use of funds: COVID relief ending ($2.1M), the expiring parcel tax ($1.2M), other staffing ($0.79M), alternative-education restructuring ($0.66M), site discretionary funds ($0.5M), maintenance ($0.5M), and bell-schedule changes ($0.3M). Here is an estimated mapping of the breakdown, organized by what we’re losing:
Enrollment by school
School enrollment over time1993–2026 ◆ census day
Tracked by CDS code across renames. Middle grades filter shows every school serving grades 6-8.
★ Combined enrollment peaked at 8,177 in 2003–04 and is down to 7,473 in 2025–26, but the decline is concentrated in the high school district (5,952 → 4,903 from its 2004 peak). The elementary district's 2,570 students is its highest in 28 years.
Cohort flowssynthetic cohorts ◆ ’93 to ’26 ◆ slide to navigate
Use the slider to follow one cohort through kindergarten (including TK, which began phasing in in ’12 and expanded toward universal eligibility from ’22) until graduation or the present day. Note: these numbers are aggregate counts for each year, not individual students being tracked over time.
School sizes at each grade are actual enrollment; which school students move to is not in the data, so those handoffs are estimated — each school’s outgoing class is assigned to the junior high and high school serving its side of town, with the remainder split proportionally (marked est. on hover); gray bands are net students joining or leaving area public schools. County-wide independent-study charters are excluded. Grade detail: NCES Common Core of Data through 2024–25 plus the CDE census-day file for 2025–26.
Elementary net gain/losssame-school cohort profile ◆ pooled 2019–2026 ◆ grade 1 = 100
The average growth or decline of a cohort from 1st grade to 6th grade. Rising lines gain students mid-stream; falling lines lose them. Kindergarten and TK are excluded.
Population-level statistics
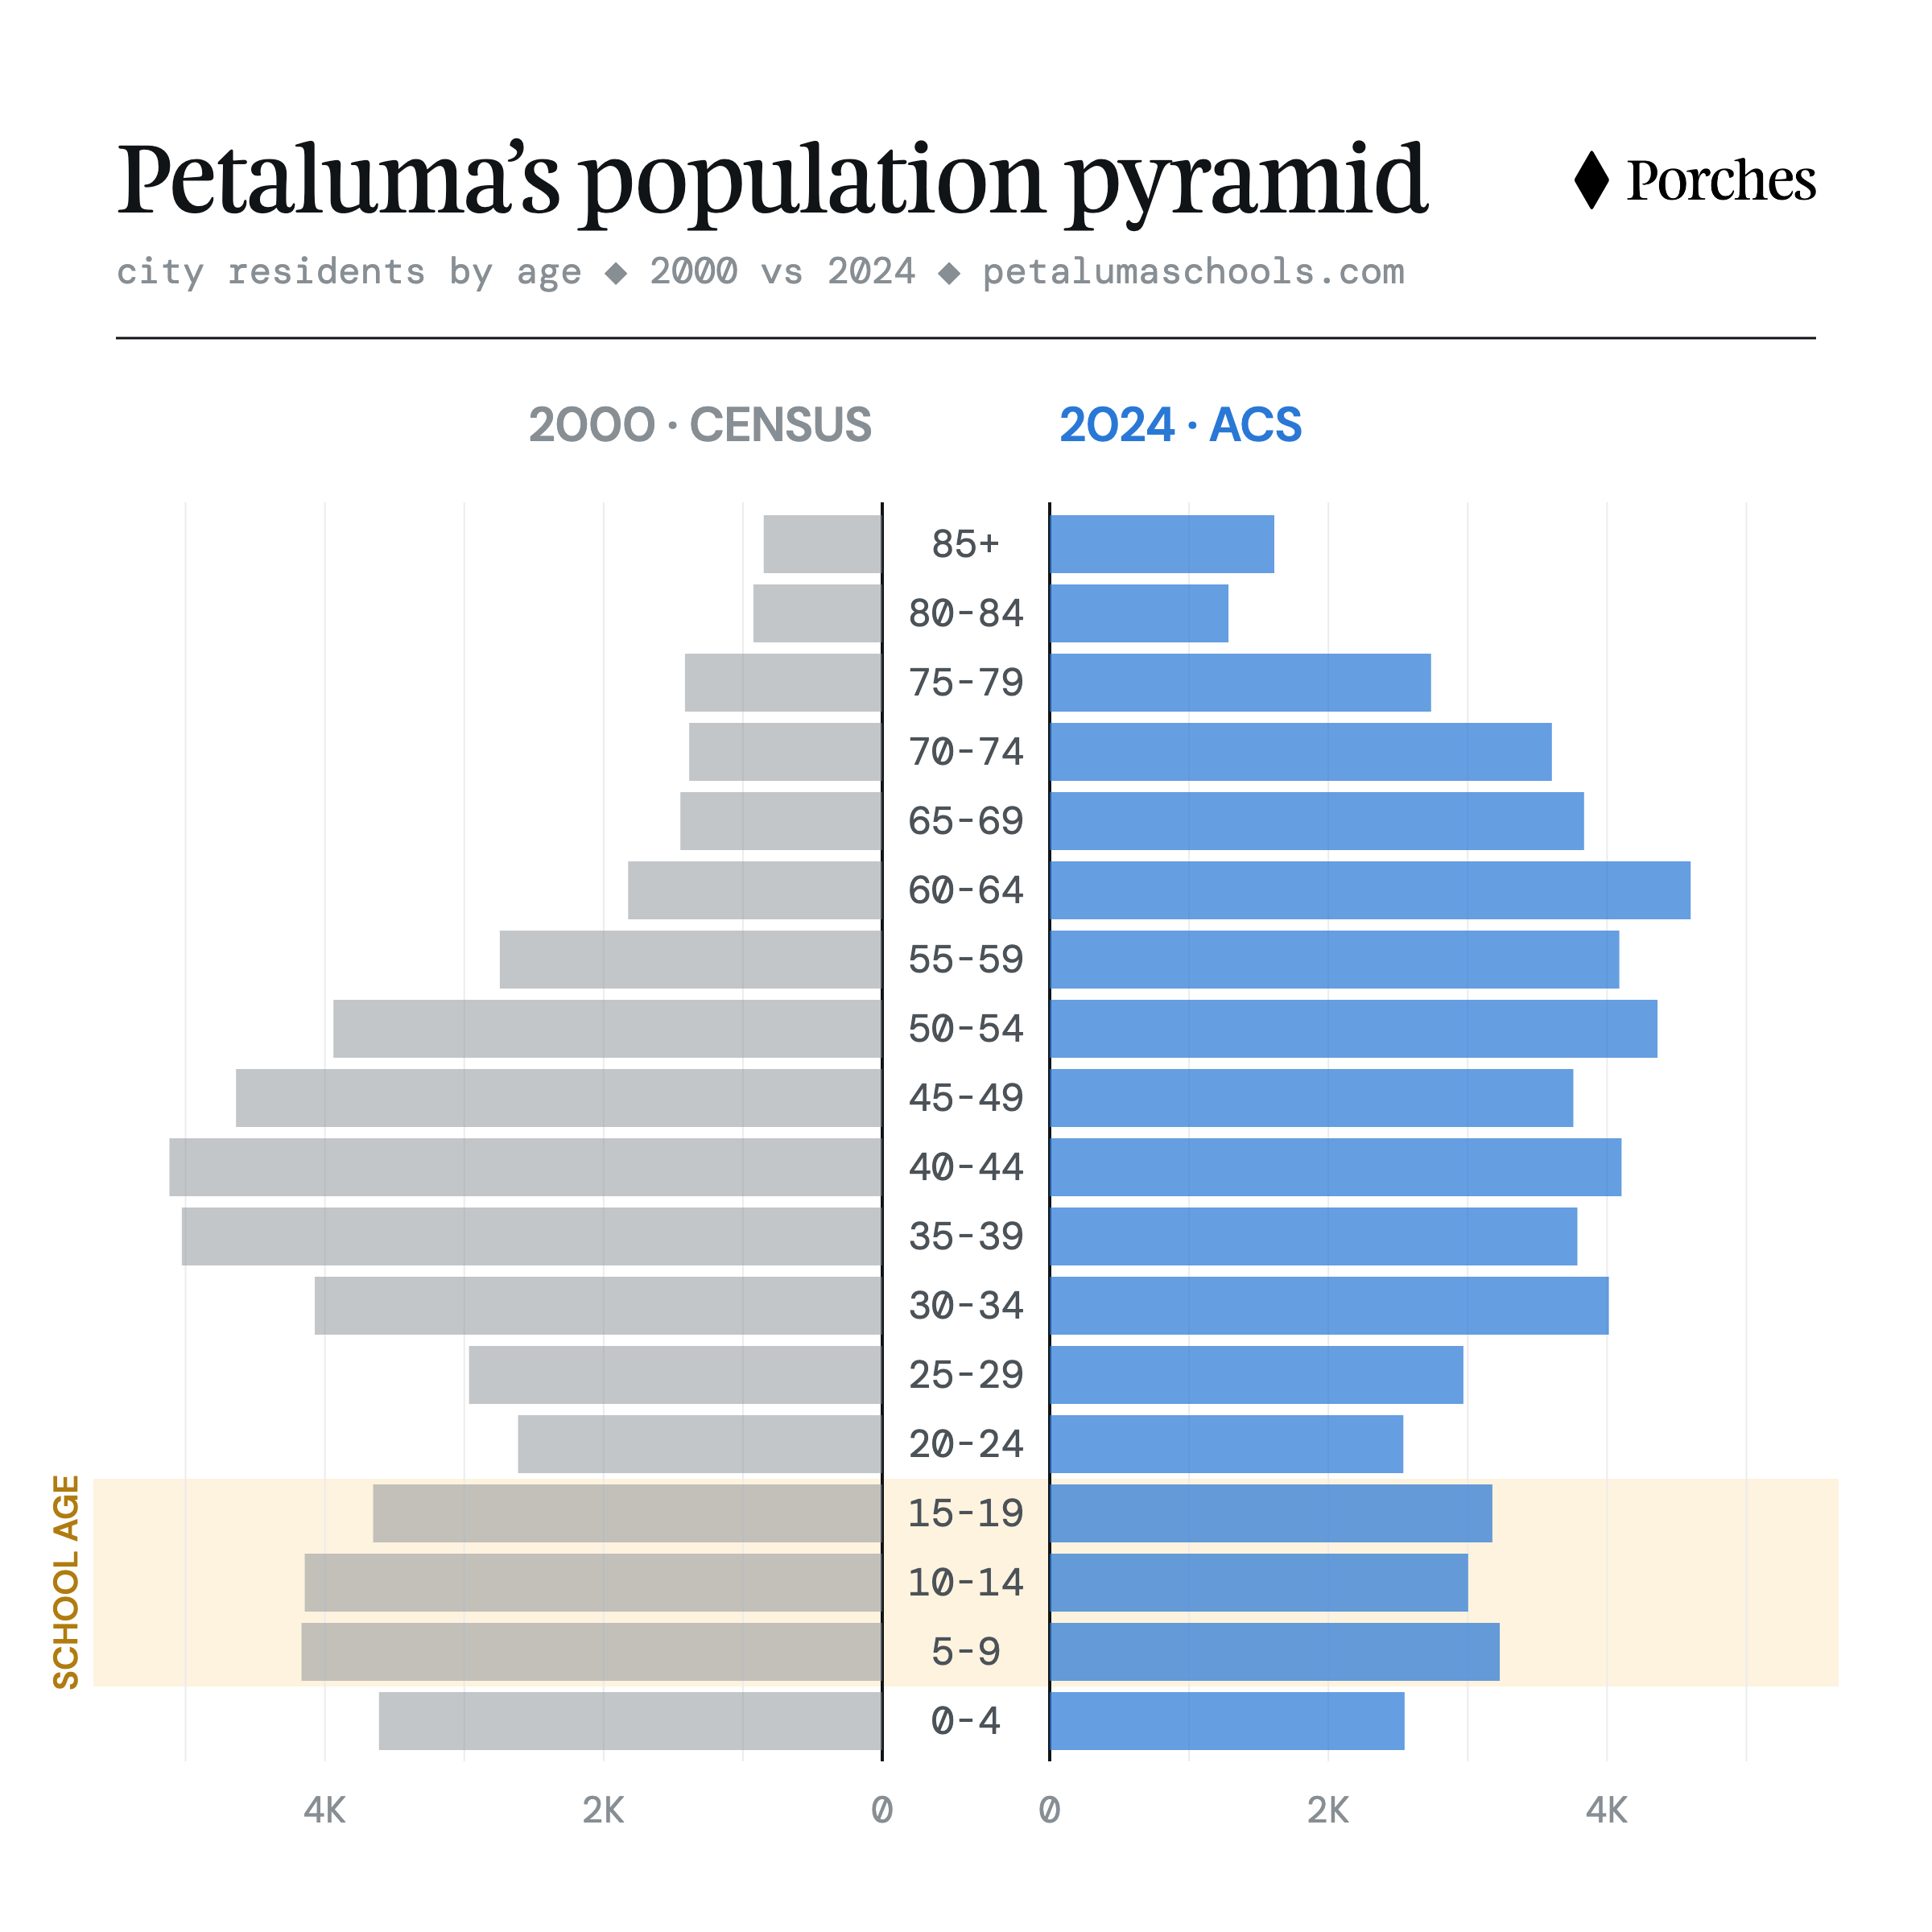
Age pyramid, 2000 vs. 2024city residents by age ◆ Census 2000 / ACS 2024
Petaluma city residents by five-year age group: the 2000 census on the left, the 2024 ACS 5-year estimate on the right (city limits only, both sexes combined; the shaded band marks school-age groups — the 15–19 bar also includes 18–19 year-olds). ACS estimates are survey-based and smoothed over five years. The comparison panel shows the same 2000→2024 change for nearby counties, the state, and the nation, from the same census tables.
Enrollment by grade1993–2026 ◆ both districts combined
Grade bands sum both districts (junior highs are High-district). Recent TK expansion (universal transitional kindergarten) props up the youngest band.
The grade-9 handoff9th graders per 100 prior-year 8th graders ◆ vs California
Above 100 means that high schools gain students at the handoff (main causes: private K–8 graduates enrolling, plus students repeating 9th grade). Statewide, the ratio’s slow decline likely reflects the fading practice of retaining students in 9th grade.
Below 100 means that 8th graders are leaving the public school district. Cotati-Rohnert Park’s rise after 2011 coincides with Credo High (a county-wide-draw charter) opening there; Sonoma County as a whole holds near 100, suggesting the movement stays largely within the county.
Net arrivals and departures by gradestudents gained (blue) or lost (red) per grade step ◆ area public schools
Each cell: how much a class grew or shrank as it moved up one grade that year — net students arriving minus leaving, across all area public schools (both districts, feeders, and local charters). Net flows, not individual students; color is capped at ±80 (a few cells run past −100). The kindergarten step is omitted: TK students are counted inside K, which would fake a large exit.
High school electivesclass sections taught ◆ 2012–13 to 2018–19 ◆ CALPADS
Sections taught in elective subject areas each fall, from the state’s class-section files (course codes grouped by subject; core academics, PE, and special-day classes excluded). Numbers in cells are sections; hover for enrollment. Two honest limits: the state stopped publishing school-level course files after 2018–19, and a reporting change around 2016–17 increased how finely schools split sections — compare which subjects exist and their enrollment, not raw section counts across that boundary.
Electives, year by yearoffered or taught ◆ 2012–13 to 2026–27 ◆ CALPADS + course catalogs
One row per elective program, colored by which high school offered it. Two sources spliced: through 2018–19, a filled cell means the class was actually taught (state class-section files); from 2020–21 on, it means the class was listed in the school’s published course catalog (a plan, not a promise — under-enrolled classes sometimes don’t run). Core academics, PE, and support classes excluded. The state renamed its course codes twice, so related codes are hand-merged into one row per program (e.g. the metal shop sequence); the full code-to-course mapping is in the site’s data pipeline. Gray: no source for that year — the state stopped publishing after 2018–19, no 2019–20 catalogs survive anywhere, Petaluma High’s 2021–22 and 2022–23 catalogs were never archived, and Casa Grande’s pre-2024 catalogs lived on a site that no longer exists. A few rows are gray through 2019 because those courses were coded under core subjects the state files can’t separate (e.g. Business Math under math).
Students per 1,000 residents1993–2026 ◆ DOF E-4
Enrolled students per 1,000 Petaluma city residents (left axis), against total city population (right axis, shaded). The dashed marker is 2022–23, when California's universal transitional kindergarten expansion began adding 4-year-olds to enrollment.
★ Petaluma's total population peaked in 2018, declined to a 2023 low, and has grown again over the past two years.
Residents vs. students, by ageindexed, 2010 = 100 ◆ 2010–2026 ◆ Census/ACS, CDE
Each color pairs a city age group (solid line: residents, census/ACS) with the matching public-school grades (dashed line: students, all area schools). Both lines indexed to 2010 = 100 so population and enrollment share one axis; census age buckets don’t align perfectly with grade bands, so read trends, not levels. Resident lines are 3-year rolling averages of ACS 5-year estimates (single-year city age counts are noisy; hover for the raw values); the decennial censuses anchor the endpoints (city residents aged 15–17: 2,353 in 2000, 2,382 in 2010, 2,301 in 2020 — flat for two decades). The elementary student line includes TK after the 2022 expansion, which props it up.
Public school enrollment (school-aged population)2000–2024 ◆ Census/ACS, CDE PSA
Shares of city residents aged 5–17 (census estimates). Local private schools include CDE Private School Affidavits: St. Vincent elementary & college prep, Harvest Christian, Spring Hill, Cypress. The residual few percent: small-affidavit homeschools, private schools outside town, and 5-year-olds not yet in kindergarten.
★ The recent jump in the enrollment rate is attributed mostly to TK.
Special report: the $229M bond program
On November 5, 2024, voters approved two school bonds: Measure Z ($70 million, elementary district) and Measure AA ($159 million, high school district), repaid through property taxes until 2059. On December 9, 2025 the school board adopted an implementation plan allocating $234 million (the bonds plus projected interest) across every campus, to be spent by 2033. The first $76 million was sold in spring 2025, and the district’s adopted 2026–27 budget puts $70 million of construction in the current school year.
The finance charts above are accrual-based, where construction is capitalized and reappears only as depreciation. The figures below use the cash (governmental-funds) basis from the same audit reports, so building programs show at full height. Bond repayments are excluded throughout: they are the same construction dollars being paid back over thirty years.
Every dollar, by yearFY2003–FY2025 ◆ audited ◆ FY2026–33 projected
★ In nominal dollars, FY2025 was the largest cash-basis year on record at $148M. The district’s own estimate for FY2026 is $182M and its adopted FY2027 budget is $218M — almost entirely construction, while the operating lines flatten under the adopted cuts.
Hatched years are projections: FY2026 is the district’s 2025–26 estimated actuals and FY2027 its adopted 2026–27 budget (general, adult-education and cafeteria funds, by function); FY2028–29 scale the FY2027 mix to the district’s multiyear projection; FY2030–33 grow 2.5%/yr. Construction after FY2027 is a drawdown of the remaining bond money following the planned 2028 and 2030 series sales — the district has published no year-by-year schedule. Refinancing pass-throughs are removed. Honors the dollars toggle above.
Four building boomsconstruction & capital outlay ◆ FY1995–FY2033
Cash spent on construction, land and building acquisition from all governmental funds. 1991 & 1992 bonds: two authorizations sold in series through 2004 (about $73M), plus state matching and developer fees; this era built Petaluma High’s science building and modernized Petaluma Junior High, among other work. Kenilworth: the old campus on East Washington Street was sold to a developer for $22M in 2004 and the new campus on Riesling Road opened in 2005. Measures C & E (2014): $89M, of which about $66M had been spent by June 2025. FY1995–99 from the Census F-33 survey; FY2000–2025 from the audits.
Where the money goesby campus ◆ $234M plan incl. interest
By site type: elementary $83M (35%), high school $48M (21%), junior high $9M (4%), district-wide $94M (40%, of which the Crinella performing arts center is $40M). By kind of work: new construction $157M (67%), repairs and building systems $61M (26%), program overhead $16M (7%). Mary Collins (TK–8) is tagged elementary in the district’s plan although it is a high-school-district charter funded by Measure AA.
The plan, line by line65 items ◆ adopted December 9, 2025
From the district’s implementation planning sheet, linked from the December 9, 2025 board packet. “vs. 2024 estimate” compares the adopted budget with the July 2024 Facilities Master Plan cost for the same project: most lines carry a uniform +28% escalation, so the outliers are the story — the Crinella performing arts center rose from $21.3M to $40M (benchmarked, per the sheet, to a $36M design-build theater in Pleasanton), and the TK/arts buildings, furniture, technology and security lines had no comparable master-plan estimate at all. Project names appear as written in the district’s sheet. Decisions on scope, timing and priority are reserved to the board by the ballot text and can be changed by majority vote; the district describes the plan as a framework that will be refined as the Facilities Master Plan advances.
Notes
Sources
Financials: Petaluma City Schools independent audit reports, FY2000–FY2025 (government-wide Statement of Activities from FY2003; combined governmental funds before). Enrollment: California Department of Education census-day enrollment files, 1993–2026, matched by CDS school code. Grade-by-school detail for cohort flows: NCES Common Core of Data via the Urban Institute Education Data Portal, 1993–2025, plus the CDE census-day file for 2025–26 (CCD counts tie out to the CDE files within 2% in all years except 2007–08, where CCD runs slightly low). Cut figures: board resolution of Feb 10, 2026, as reported by the Petaluma Argus-Courier.
Inflation adjustment uses the CPI-U annual average in 2025 dollars, on by default. Known restatements are applied: FY2011 uses the FY2012 audit's corrected figures (the FY2011 audit repeats FY2010's tax lines); FY2023 uses the FY2024 audit's +$665K restatement. Accrual-basis expense differs from the district's operating budget (≈$137.6M in 2025–26). Non-school units (district office, nonpublic placements, county consortium) are excluded from school charts.
Bond program: construction and debt-service lines from the governmental-funds statements in the same audit reports (FY2000–2025) and the Census Bureau’s F-33 school-finance survey (FY1995–99); bond history from the FY2000 and FY2009 audits’ bonded-debt schedules; FY2026–27 figures from the district’s adopted 2026–27 budget (SACS forms, by fund and function); plan line items from the December 9, 2025 board packet and its linked planning sheet; ballot text from the Sonoma County voter information guide.
Built by Porches
Built by the team at Porches: an app custom-made for Petaluma, with original stories, recommendations, and insights about the place we call home.
A few recent features related to Petaluma schools:

Common questions
How much does Petaluma spend per student?
About $19,600 per enrolled student in fiscal year 2025 (an all-time high, even adjusted for inflation). See per-student spending.
How many students attend Petaluma City Schools?
7,473 students in 2025–26 across its elementary, middle, and high schools. Several thousand more Petaluma-area students attend the independent elementary districts that feed the high school district. See enrollment by school.
How big is the Petaluma City Schools budget?
In fiscal year 2025 the districts took in $140.4 million and spent $145.6 million (audited, accrual basis) representing a $5.2 million deficit. See source of funds and net result.
Why is the district cutting $6.1 million?
Temporary funds (COVID relief, one-time state grants, an expiring parcel tax) are evaporating while state aid also fell by $5 million in FY2025. See the special report.
Is enrollment declining?
Down about 9% from the 2003–04 peak, but concentrated in the high school district — the elementary district is at a 28-year high. See enrollment by grade.